What are the advantages of using a data analytics tool like IQConnect?
“We find that most companies, with historical billing systems, are being wrongly charged an average of 30 to 40%. IQConnect business analytics automatic invoicing provides quick, detailed, real-time billing based on actual usage, not inaccurate estimates. Think about how this alone could save your business untold expense.”
Smart Decision-Making Based on Actual Data
Accessibility to important data gives companies the power to make accurate decisions that could leverage businesses. Not only does it provide useful data, it also allows companies to make decisions faster and more efficiently than before.
Clearer Insights Through Data Visualization
Data that is presented in a clear an comprehensive way is more easily understood and acted upon. The end result of any data analytics is to structure data so that it is relevant, offering insights to make better decisions.
Efficiency & Accuracy Across Your Organization
Business processes are at the core of any organization’s performance, and their efficiency is vital. Manual interventions, bottlenecks, and other issues can affect business process performance in harmful ways that are often difficult to detect.
Transparency Into Your Business Processes
IQConnect gathers information in real-time giving our clients the most up to date information about their systems. This allows you to evaluate people and processes more quickly resulting in faster more profitable results.
Research shows that more and more companies are using data insights to achieve success.
75%
Competitive Advantage
75% say they use their data to gain an advantage over their competition.
70%
Better Business Decisions
70% say they use their data to make more informed decisions.
63%
Internal Reporting
63% say they use their data to more accurately report internal activity.
IQConnect business analytics is a powerful tool which offers companies three types of data analytics: Descriptive, such as dashboards, Predictive which uses past data to model future outcomes and Prescriptive which uses comparative models to help you optimize current processes. IQConnect uses these analytics disciplines to show you the benefits you can gain from streamlining your documents, users, and processes.
[om_cc_vc_device_element device_type=”om-cc-real” device_real_mockup=”om-cc-desktop” content_position_type=”om-cc-middle”]
 [/om_cc_vc_device_element]
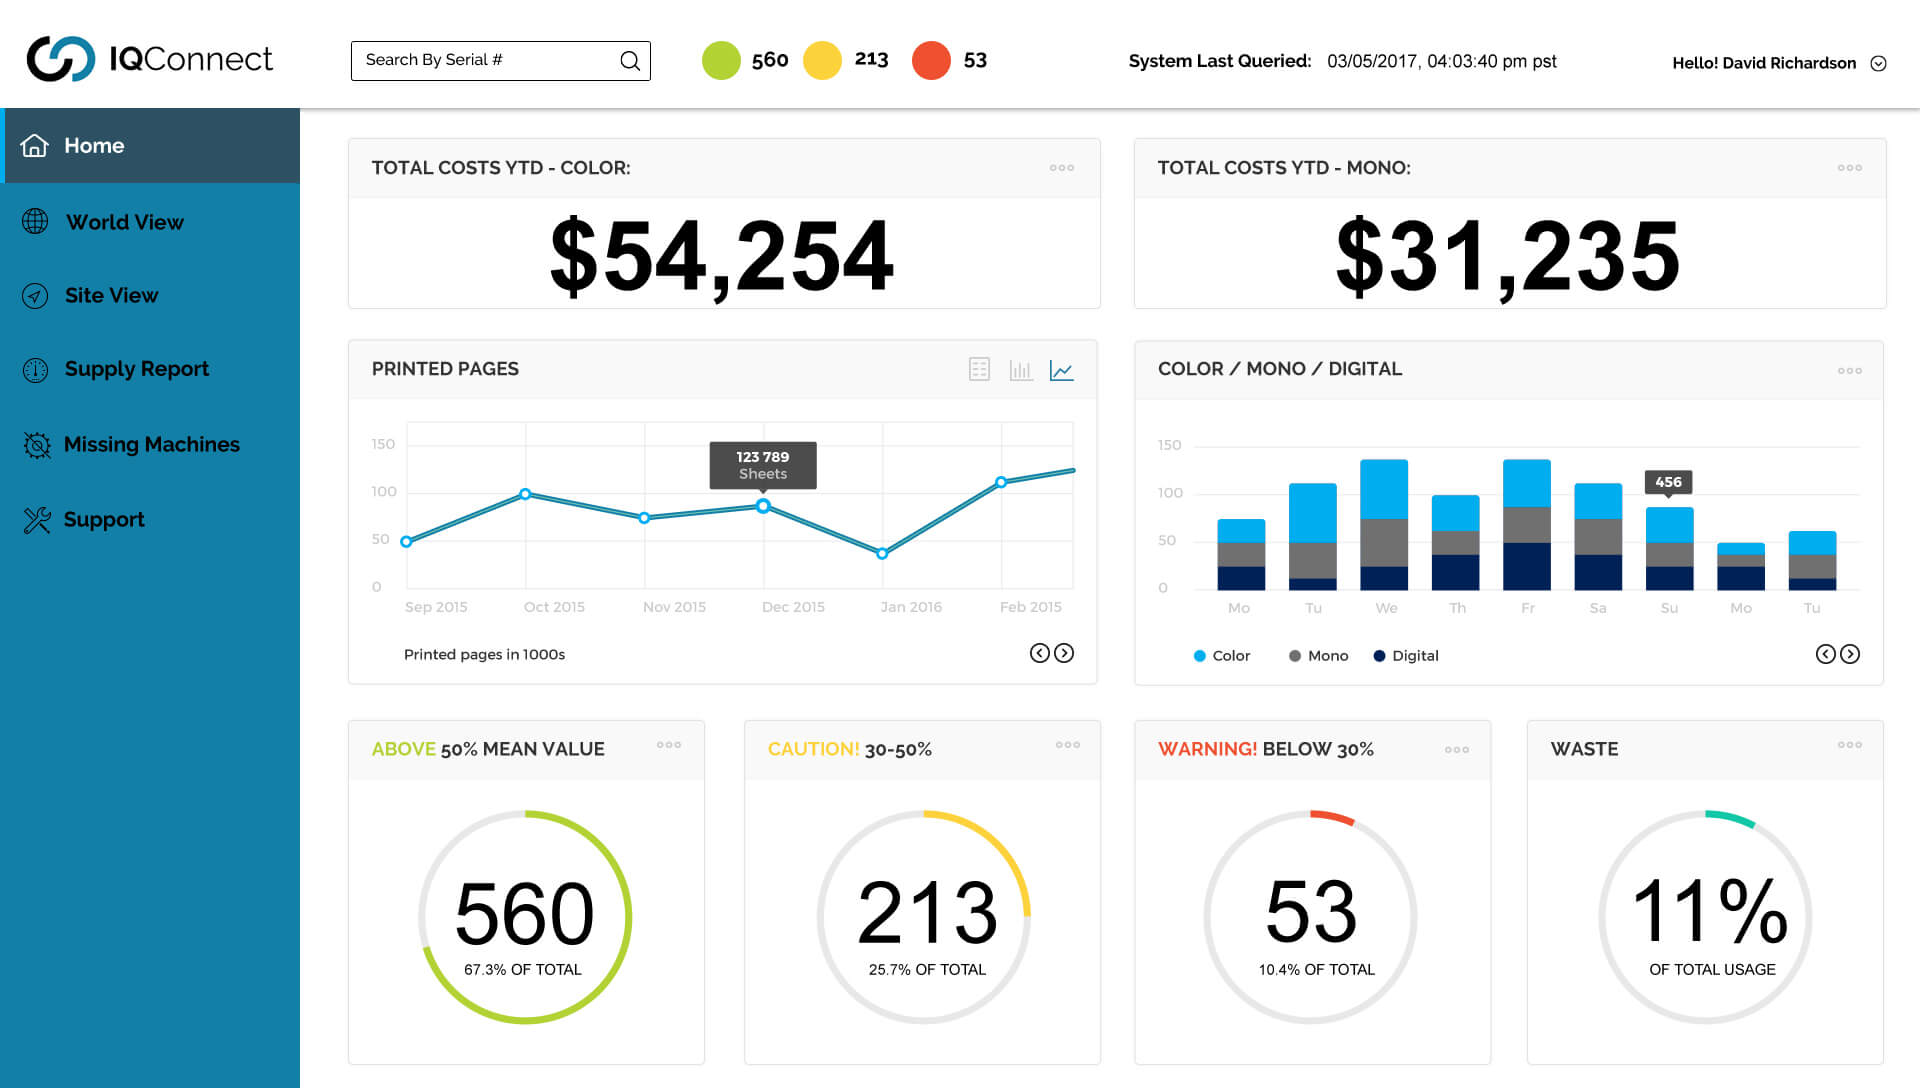
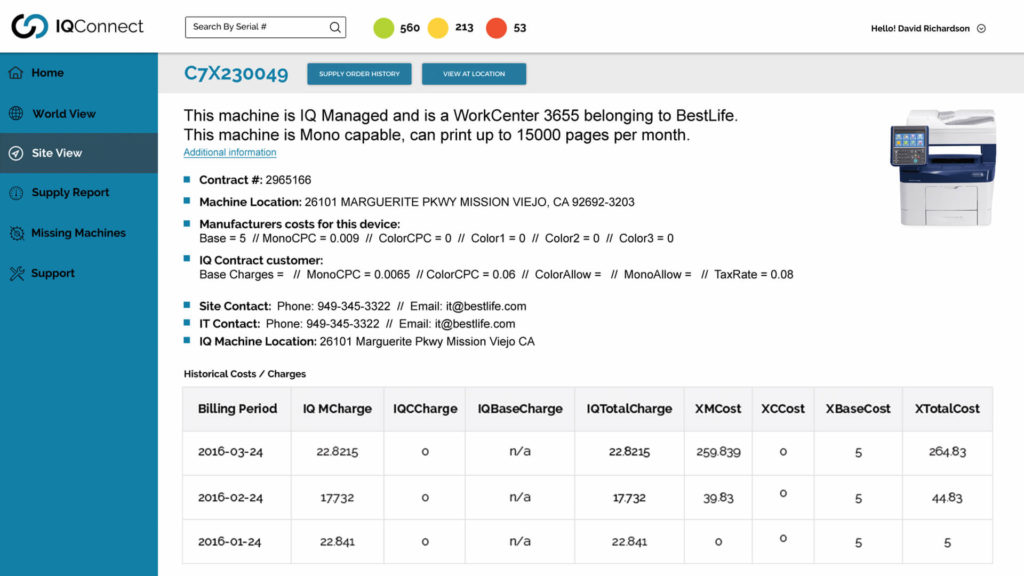
Clear Data Visualization
Dashboard shows overall state of health
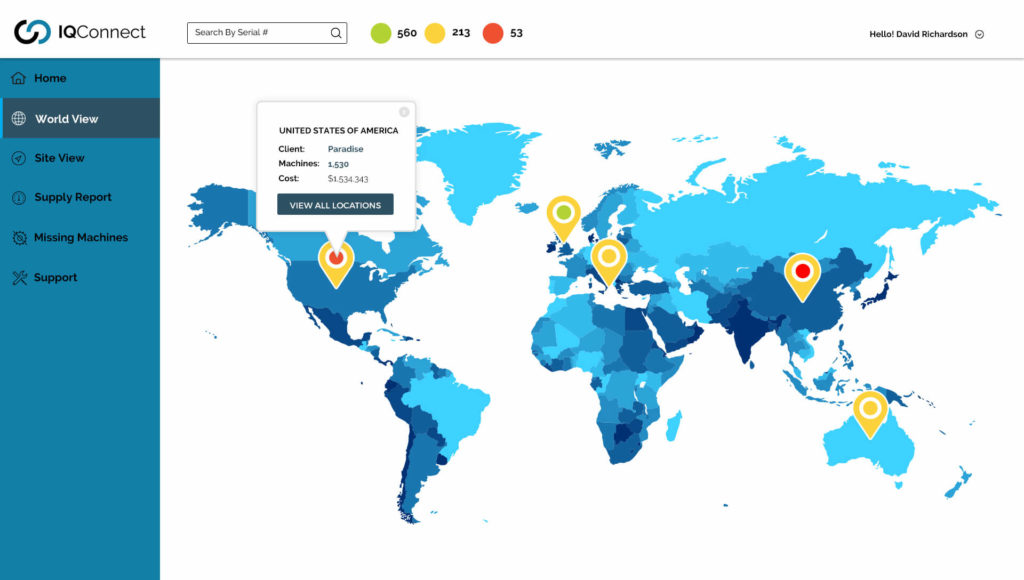
IQConnect business analytics dashboard which allows you to aggregate, customize and report on your data. In this example, we have gathered data from network connected printers, copiers and multi-function devices. This real-time data has been customized to display accumulated costs, machine availability, and consumables. By visualizing this information in a single view you can more accurately know actual costs and systems efficiency revealing some eye-opening insights.

Real-time insight into document management, device usage or user interactions
-
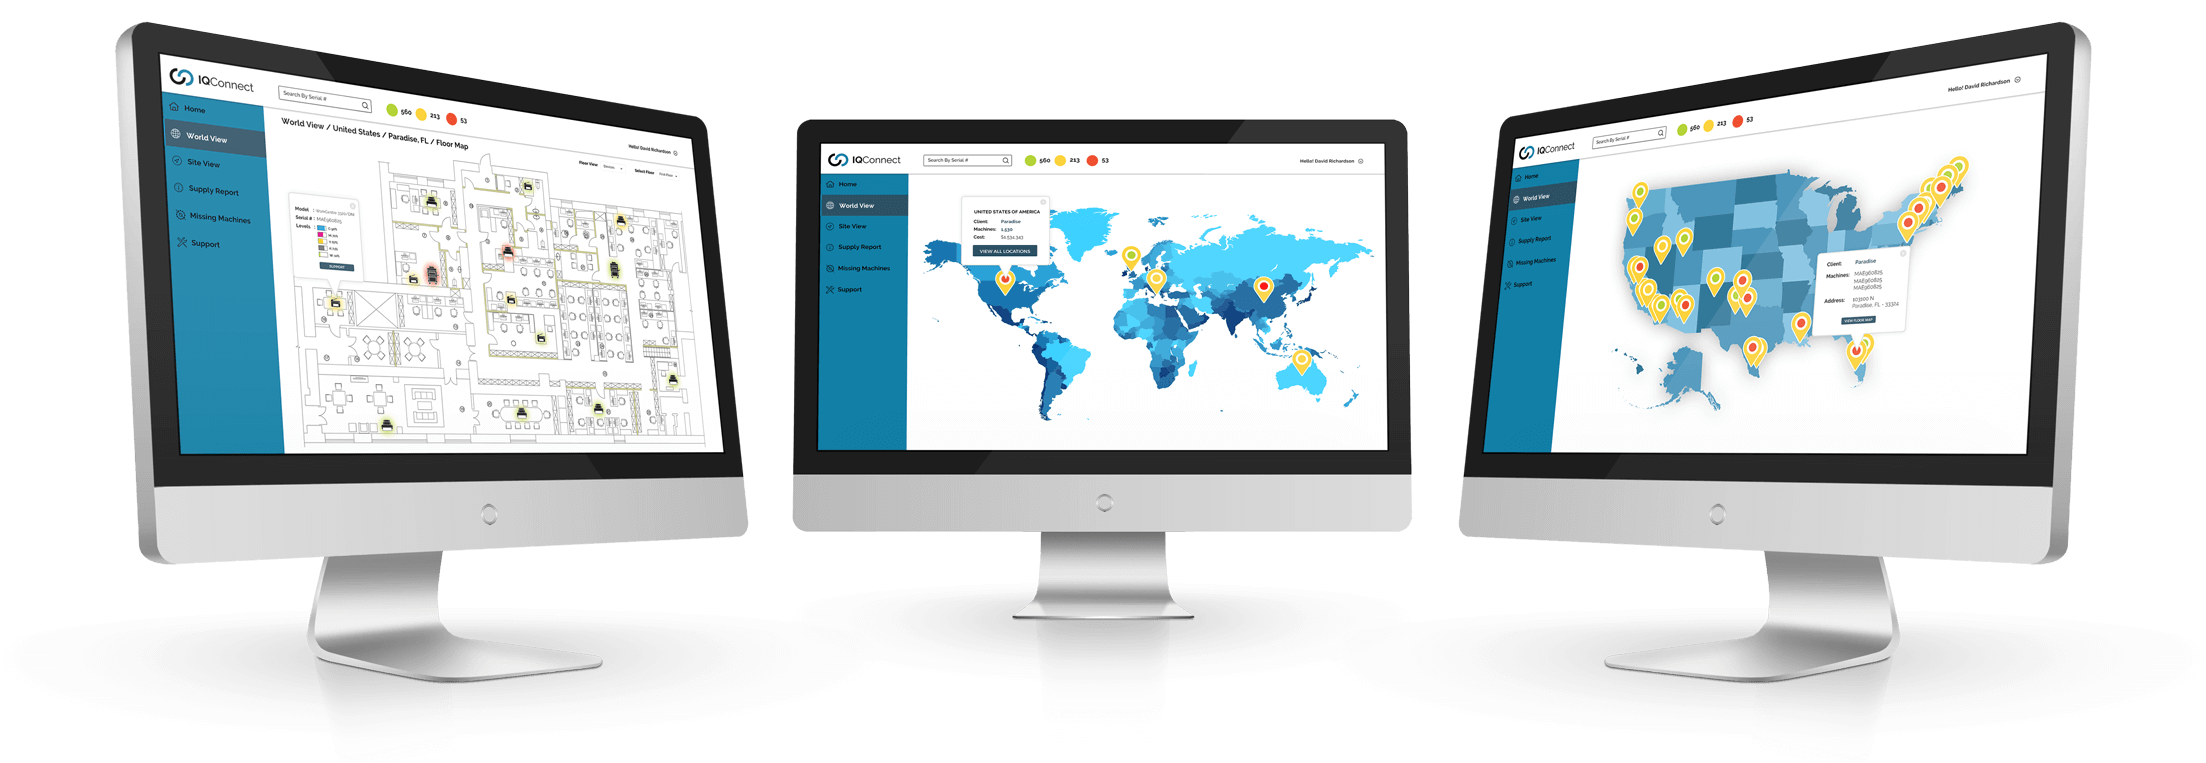
Access all of your device location and usage information from one place.
-
Structured information helps you make smarter, faster decisions

[om_cc_vc_device_element device_type=”om-cc-real” device_real_mockup=”om-cc-desktop” content_position_type=”om-cc-middle”]
 [/om_cc_vc_device_element]
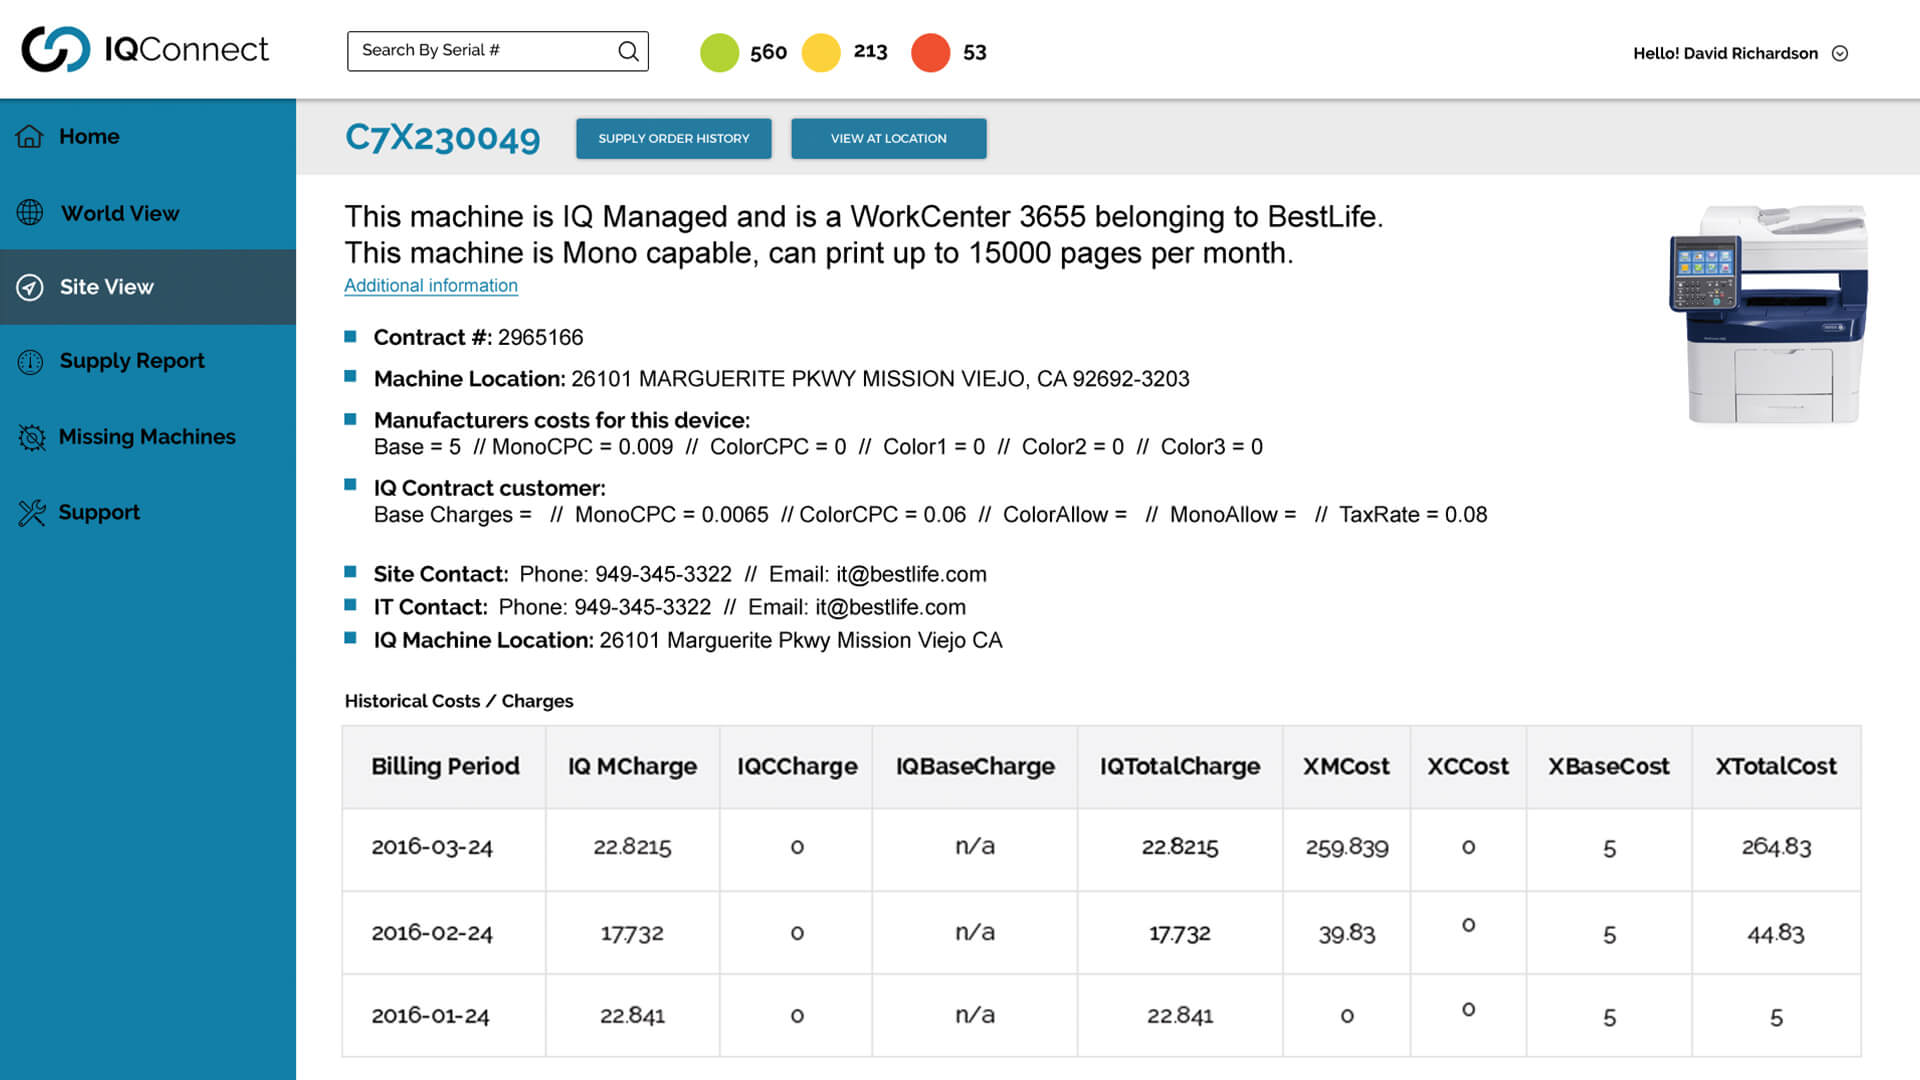
Down to the Details
Top down data availability offers actionable information at the device level
Device analytics, in this example, on the device detail screen, can show you print volumes and costs: how much you’re printing, and how much you’re paying to print it. Also displayed is important information such as machine type, location, support information, leasing and or contract details. At the click of a mouse all of this data is collected and structured so that you can identify under or over utilized hardware.
-
Location data so that you can control inventory and find lost devices
-
Consolidate important information such as support contact information and insights
-
Data showing device usage gives you an actual cost, versus manufacturer estimated cost, of operating your machines.
Data to help you make better decisions
Device analytics helps you make an informed decision about the devices you really need across your business, where you need them and what resources should be allocated to them. You can also optimize the way you use your devices, to make sure none of them are over or under-utilized.
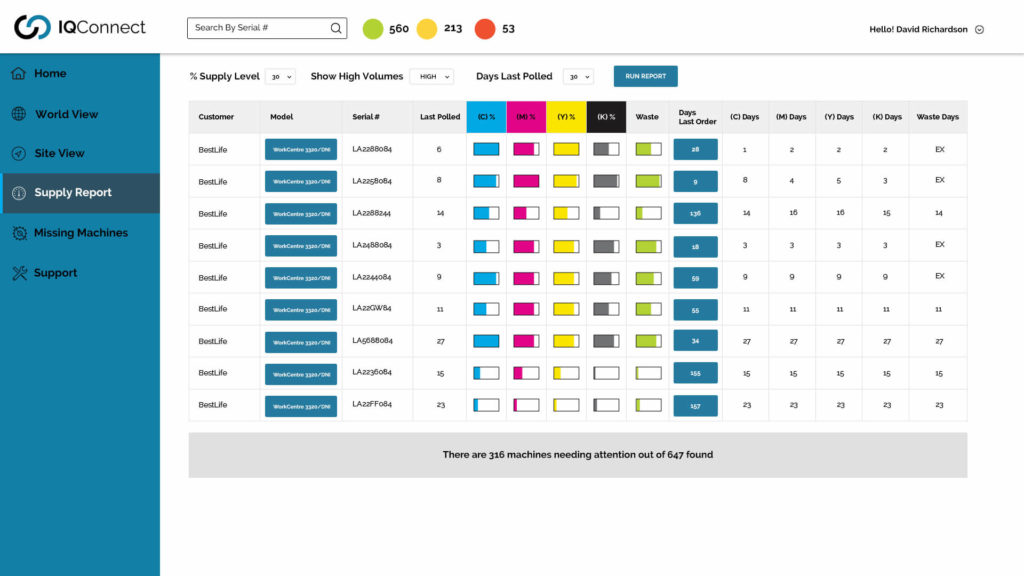
Supply Report Workflow predicts when devices need attention
One of the greatest opportunities to apply predictive analytics is the management of devices and consumables. IQConnect’s supply reporting aggregator can help you predict when a machine needs attention, showing current levels and supply history.
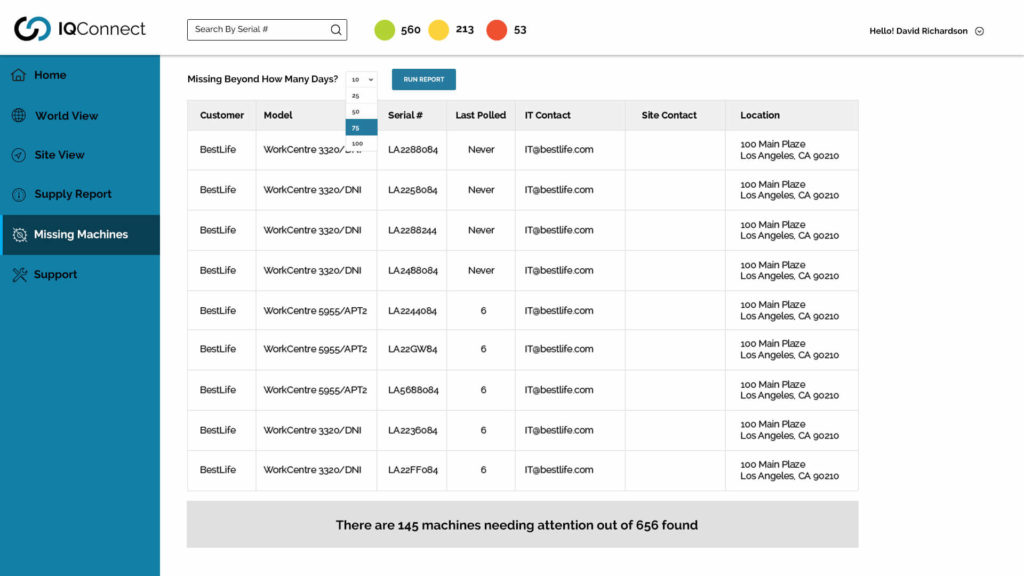
The Missing Device report helps you control inventory
Diagnose lost devices that have disappeared off your network. We have had customers that were paying expensive lease payments for machines that were sitting in a warehouse unused. Our QR Code based system tracks and reports on each devices location.

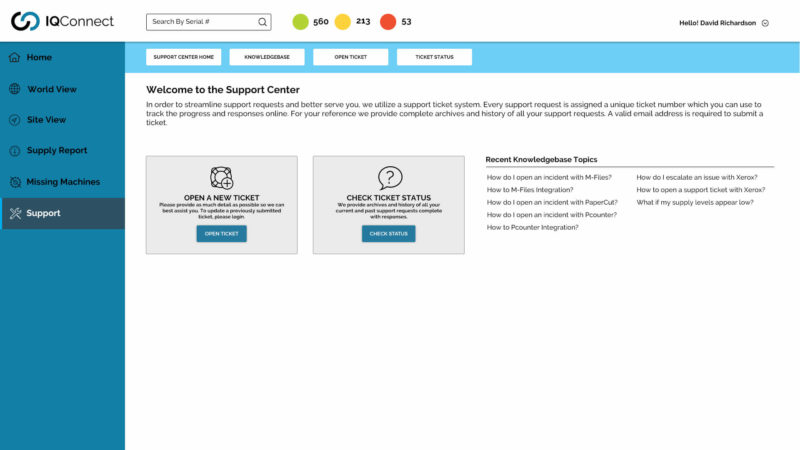
U.S. based support above and beyond the manufacturer
Knowing that there will always be problems to solve, we have added a ticketing and support system into the software so that all concerns can be addressed right away. Our support staff is available to you 24 /7 to answer any questions or provide any material assistance.
“Our company has grown to meet the demands of our customers. Their greatest request has been for systems that can centralize and present relevant data in a clear and comprehensive way that is more easily understood and acted upon.”
In response to this, we developed the IQConnect business analytics tool. Our software allows universal transparency, aggregating data from the largest global corporate networks, to the smallest systems, allowing our clients visibility from the highest levels down to individual machines. This has allowed our clients to simplify the management of documents, devices, and processes and to reduce the workforce and service costs associated with them.